Hybrid Office Design: 4 Data-Driven Tips
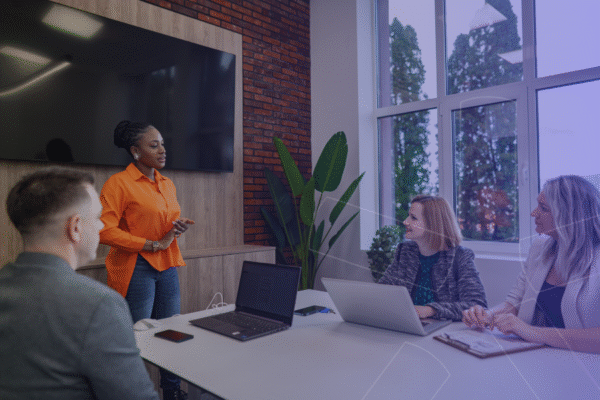
Effective hybrid office design uses actual workplace data for the layout, arrangement and allocation of space. Here are four ways to use data to shape your hybrid workplace around the ways people are actually using it.
Jackie Towers
This study found that open plan offices actually decreased face-to-face collaboration by 70%.
The same holds true today for hybrid office design.
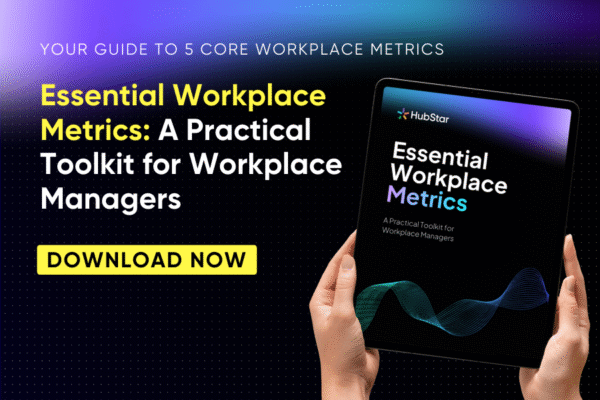
How do you get the right data for hybrid office design?
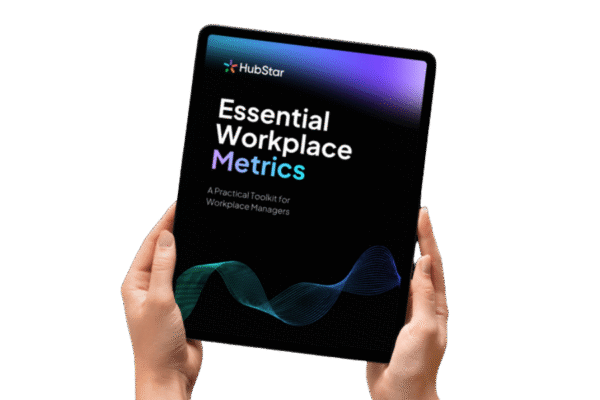
Download this practical toolkit the 5 core workplace metrics that provide the right data for effective hybrid office design.
What is Data-Driven Hybrid Office Design?
Data-driven hybrid office design is the practice of using occupancy, utilization, and employee behavioral data, rather than intuition or historical assumptions, as the input for decisions about space allocation, office layouts, room configuration, furniture, amenities and even policies.
Similarly to how website designers use heat maps to improve user experience and increase conversions, data-driven office design measures occupancy and employee data in order to continuously improve the hybrid office.
Where Does the Data Come From?
- Employee workplace surveys
- Employee interviews and focus groups. For example, Maine-based supermarket Hannaford included an employee-led working group in their HQ redesign
- Space utilization data from occupancy sensors and WiFi signals
- Booking data from room and desk booking systems
Benefits of Data-Driven Hybrid Office Design
✅An office that’s worth the commute
After the pandemic, experts predicted the “death of physical retail”. And although numerous retailers went bust, stores are still here. That’s because successful retailers reinvented the store as an experience that offered people something that online shopping didn’t.
Hybrid offices are facing the same challenge. HubStar’s Hybrid Occupancy Index found that globally, office utilization is hovering between 50 and 60%. That leaves vacancy rates of at least 40%, giving organizations the opportunity to make the most of those empty spaces through redesigns.
Global investment management company Colliers saw their office attendance increase by 50% after an office redesign, for example.
✅Community and connection
In an Australian study that interviewed eight experts from international workplace design firms, six mentioned a sense of belonging as one of their main considerations in the design process.
Workplace design facilitates those moments of connection and serendipity in the office that add a little spark to your day – running into your work bestie, finding things in common with colleagues and meeting new people from different teams.
Psychiatrist Edward Hallowell refers to these as human moments – “An authentic psychological encounter that can only happen when two people share the same physical space.”
Ultimately, the office should be a visual manifestation of company identity, and be a place where employees can go to physically experience that. Architecture, layout and design can actually strengthen our connection and identity as part of an organization, according to the concept of Place-Identity Theory.
3 Things Destroying Social Connection in Your Hybrid Office
Is your workplace hindering instead of helping social connection between individuals and teams? If you're unintentionally doing any of these 3 things, it could be.

✅Cost savings from a rightsized CRE portfolio
The upside of not having everyone in five days a week is needing less space. Or at least not having to keep HVAC on full blast in empty spaces no one is using.
50% of respondents in Cisco’s Global Hybrid Work Study 2025 reported that their organization has reduced its real estate footprint over the last five years. That’s a massive cost savings scaled across multiple offices and countries.
Another benefit of (effective) hybrid office design is the maintenance of these savings without unintentionally getting rid of the parts of office employees actually use.
And that’s where occupancy data comes into play.
4 Data-Driven Hybrid Office Design Tips
1) Increase desk-sharing ratios with utilization data.
Back in the day when everyone had directly assigned workstations, this desk sharing ratio was one to one, five days per week.
More than 60% of organizations now report having a target sharing ratio at or above 1.5 employees per desk compared to traditional 1:1 ratios.
That might sound like it’s running the risk of overcrowding. But when done carefully with desk utilization data as guidance, increasing sharing ratios provides more space for the environments that actually draw people into the office.
The data from over the last five years or so consistently shows us that these environments are the collaborative ones, while sitting at a desk can just as easily be done at home.
But not always, and not for everyone.
Occupancy data shows you exactly where you can dial up the ratio of employees to desks without heading into lack of elbow space territory or taking away the workstation someone needs to be productive.
Even on an individual floor, different teams and neighborhoods are going to use desks differently.
Engineers and developers are probably going to spend a good chunk of the day at a desk with the three different monitors they need, for example.
Everyone else will probably drift between different meeting rooms and collaboration spaces, but even here there are outliers.
Measuring space utilization weekly, daily and even hourly is the only way to understand these differences in desk usage at scale.
Bumping up desk sharing ratios does three things for the effectiveness of your hybrid office design:
- Reduces overall portfolio square footage
- Gets a better buzz going in areas that used to feel like a ghost town
- Informs choice of furniture and amenities, e.g. lockers in areas with higher desk sharing ratios
2) Right-size meeting rooms based on actual occupancy.
Those big executive boardroom style conferences are so 2019.
For most organizations, that is. Yours could be different.
As a general rule, hybrid makes it unlikely that every meeting participant is going to be physically in the room. Hanging onto a portfolio that’s mostly huge empty rooms doesn’t reflect what people are actually using meeting rooms for – small meetings where around half of the participants are dialling in remotely.
Measuring room utilization tells you which of your bigger, emptier rooms can be safely repurposed into one or two smaller ones. That solves the number one office complaint – the absence of meeting rooms, and saves on costs that would have gone towards HVAC in rooms no one ever uses.
Measuring room utilization doesn’t just indicate the ideal configuration of meeting room sizes, but also the ideal configuration of room types.
A few differentiating factors to compare are:
- Style: formal (tables and chairs) vs informal (sofa seating)
- A/V equipment: the full stack or limited
- Privacy: fishbowl-style or a sound-proofed office pod
A/V equipment is a big one here, because its presence or lack thereof in meeting rooms could be actively damaging collaboration.
Rescheduling that meeting for the second time because there are no rooms with working speakers or screens is a prime example of this because it’s preventing teams from speaking to each other.
Only 49% of employees in Cisco’s Global Hybrid Work Survey think their workplace tech enables smooth workflows between locations, so most organizations will have some catching up to do.
Data from employee surveys and feedback is also valuable for pinpointing where meeting room tech is making hybrid office design less effective.
A Buyer's Guide to Room Booking Software
Choosing the right room booking software does a lot more than help people find the right room. Here's why, and the critical questions to ask the vendors on your shortlist.
3) Pilot design changes on a small scale before fully investing.
Even something as seemingly innocuous as furniture has a massive impact on workplace experience.
“Furniture choice is very important,” stated one participant in a study on future office layouts. “I had meetings around enormous boardroom tables that actually stopped conversations happening and stopped connection forming.”
This paper from London’s Brunel University synthesized 55 previous studies on the impact of working environment on employee wellbeing and found that sensory environments (e.g. ones that reduce noise) mattered more than actual layouts themselves.
This is also an area where companies fall victim to the error of assuming they just know what people want out of the office. The scourge of ping-pong tables and beer fridges in pre-pandemic job postings is testament to this.
Piloting small scale design changes and measuring the outcomes demonstrates the ROI before making larger investments, which ensures the new design will meet its objectives. This is valid for anything from new chairs to coffee lounges, kitchenettes and big all-hands spaces.
Following a hypothesize – pilot – measure – iterate method can save organizations millions and avoid wasting budget on spaces and amenities people don’t want.
“You can learn on a smaller scale as opposed to redoing 100,000 square feet of space and spending millions of dollars, only to realize it doesn’t work,” says Tanisha Krishnan, Head of Workplace Strategy at BNP Paribas. “The same applies to investing in massive programs – whether that’s free food or other amenities – we don’t know if they’ll work until we test them.”
“But it’s not just about testing on a smaller scale. Taking the learnings from those tests to improve and create something better is equally important. There are so many small insights you gain from these experiments.”
Watch episode #3 of Workplace Visionaries for more small-scale design test tips
We spoke with Tanisha Krishnan about everything from misconceptions about office utilization to why amenities aren't the answer to boosting attendance. Watch the full episode here!

4) Use occupancy data to reduce operating costs and carbon emissions.
Portfolio reduction as a natural consequence of hybrid work already cuts costs and carbon emissions.
Building operations are still responsible for 28% of global carbon emissions, however.
With hybrid work’s variable attendance patterns, many organizations are keeping the entire portfolio operating at full steam ahead five days a week when occupancy peaks and troughs depending on the day, week or month.
Adding space utilization data to the mix can help make sure each space’s spend on energy and facilities is proportionate to the number of people using it.
The Netherlands’ Radboud University saved €55,000 by measuring utilization and strategically closing down specific campus buildings over the holiday period, for example.
Tracking occupancy data also highlights places to slash operating costs and environmental impact in these three ways:
- Use self-contained, modular layouts and design styles for spaces that get used less
- Use policies, amenities and events as an extension of hybrid office design to smooth out occupancy levels over the week. FlexIndex’s Q3 2025 Report found that most companies with a minimum in-office days policy have Tuesday, Wednesday and Thursday as the most popular days. That creates under-utilization on Mondays and Fridays, where redesigns, events and policies could even things out
- Fit more people into less space. Research by Cornell University and Microsoft found that seat sharing can reduce carbon footprint by 28%
Which metrics give you the data that drives hybrid office design?
And where should that data come from? Download this practical workplace metrics tool kit for more.
Jackie Towers
Share this post