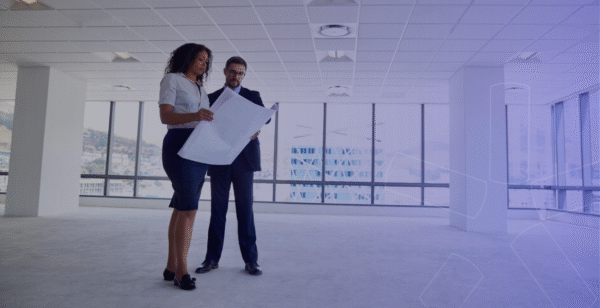
5 Office Space Utilization Metrics for a Better Workplace in 2026
The five key office space utilization metrics are: average utilization rate, peak utilization rate, weekly utilization patterns, long-term utilization trends, and predicted utilization rate. Together, these metrics reveal how effectively your office is being used and help you build a better workplace.
Jackie Towers

46% of companies surveyed by CBRE use office space utilization to plan out hybrid work programs at their organization. 89% consider it the most valuable metric available for planning out office spaces and how people occupy them.
It hasn’t always been this way, but it’s not an overstatement to say that as a collective, organizations believe tracking office space utilization is critical.
But what many don’t realize is that space utilization isn’t just one metric – it’s a group of metrics. So depending on how broad or specific you get with it, there’s a massive number of workplace outcomes.
Building a better workplace should be one of them, because globally, only 38% of employees believe their company provides one.
In this post, we’ll cover everything workplace leaders need to know about office space utilization and five metrics your organization should be measuring ASAP to build a better workplace in 2026.
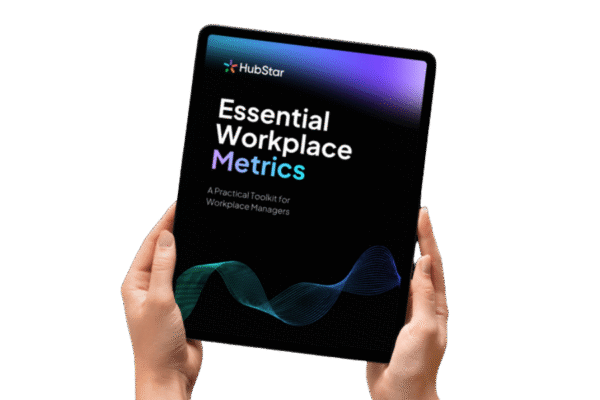
Guide: Essential Workplace Metrics for 2026
Download this guide for a practical toolkit on how to measure and effectively use space utilization, employee survey data and much more.
What is office space utilization?
Office space utilization is a group of metrics that measure how effectively people are using a space. That could be by crowding it to its full capacity, not using it at all, and everything in between.
More specifically, space utilization is the actual hours a specific space was in use relative to the space’s capacity and the time that space was available, calculated as a percentage.
Office space utilization metrics measure how effectively space is being used, and therefore, how effective the workplace is. They paint a picture of how workspaces can be better used and managed.
Measuring space utilization helps organizations:
- Identify underused spaces that are sitting empty
- Identify which spaces are crowded and close to capacity
- Understand work habits and preferences to improve office design
- Making data-driven decisions for new office designs, layouts, amenities and portfolio resizes
Office space utilization measures what’s actually happening in the office. That’s why it’s become so incredibly useful for workplaces with variable hybrid work patterns over the last several years.
Headcount, speculations and assumptions about what makes a better workplace aren’t sufficient anymore, and the majority of organizations know it.
What is Workplace Experience? A Guide for Hybrid Workplaces
Check out this post for the consequences of an undefined workplace experience and 3 areas to focus on to improve yours.

How is office space utilization calculated?
Office space utilization is calculated by dividing the people count of a specific workspace over a specific timeframe by the space’s capacity for that same time frame.
For example, if an office neighborhood with a total capacity of 30 people is occupied by 8 people over an hour, the neighborhood’s space utilization rate is 27%.
Time interval: One hour
People count: 8
Space capacity: 30
8 (people actually using the space)/ 30 (space’s capacity) = .266 X 100 = 27%
What’s the difference between office occupancy and office space utilization?
They’re similar, but not exactly the same. Confusing these two terms limits how effective you’ll be at measuring workplace effectiveness, so it’s important to differentiate them.
Office occupancy solely measures if a space was used. Office space utilization measures how the space was used.
Occupancy answers the question “were there any people in this space?” while space utilization answers the question “how full or empty was this space over a given time frame?”
Measuring office occupancy is still useful, but it highlights far fewer ways to build a better, more cost effective workplace than space utilization does.
So with that in mind, here are five office space utilization metrics every workplace leader should start tracking ASAP, and how you can use them to build a better workplace in 2026.
1. Average office space utilization rate
What it is:
It’s the OG metric – the average percentage of space in a building, floor or zone occupied by employees compared to the space’s total capacity over a specific time frame.
Average hourly, daily and weekly space utilization rates tend to be the most useful.
For example, an office floor open 10 hours a day, five days per week has an average hourly utilization rate of 40%. That’s an average of the 50 hourly utilization rates for that floor.
How to calculate it:
Calculate the average based on the utilization rate of each time interval, e.g. hours or days.
For example, to calculate the average daily utilization rate for an office floor open five days per week:
|
Monday |
Tuesday |
Wednesday |
Thursday |
Friday |
|
25% |
60% |
70% |
50% |
15% |
172% (total)/5 = 44% daily utilization rate
At first glance, a daily average rate of 44% doesn’t look all that great. It means that more than half of the floor is empty. But once we look at all the data, it’s evident that Wednesdays are getting a bit crowded, while Mondays and Fridays are a bit of a ghost town.
That’s the real value of average utilization rate – it allows you to drill down into smaller time segments to get a detailed understanding of how employees are using spaces down to the minute (if you have that kind of data) while zooming out to understand how spaces are occupied on a portfolio level.
The only limitation here is the speed and frequency your organization can collect data. We’ll get more into that later.
How to use average space utilization rate to build a better workplace:
- Get the right level of office buzz. More than half of organizations report that a lack of office vibrancy is a challenge, and measuring average utilization rates by hour or day of the week gives you a good idea of the general vibe. If it’s over or under-crowded, new hybrid policies, adding or removing space are good fixes
- Repurpose empty spaces into the ones employees actually want. People vote with their feet, and the areas with the highest average utilization tend to be the ones employees find the most value from
- Improve space allocation based on data, not assumptions. If you’ve ever run into the problem of giving a department more space that they claim they desperately need, only to see it sitting empty, this is the fix for you
How to Use Data to Design Your Hybrid Office
The right way to design a hybrid office is stumping even the most innovative and forward-thinking companies. Here's how to use workplace data to get it right.
2. Peak space utilization rate
What it is:
The space utilization rate of office spaces when they’re at their peak, or highest, people count. It’s most commonly used to work out which day of the week is the busiest, but can also be used hourly.
How to calculate it:
It’s pretty straightforward – find the highest utilization rate over a given time period. For a more consistent view across days, weeks and months, compare peak utilization rates.
How to use peak space utilization rate to build a better workplace:
- Prevent the dreaded desk shortage. 55% of organizations have underdone a portfolio downsize this year. With less space available, keeping an eye on peaks makes sure there’s always room for everyone, even on peak days
- Improve space planning processes. The best configurations of spaces change in the blink of an eye with hybrid work. Keeping a constant eye on how close peaks are getting to capacity gives space planners and managers more time to add and repurpose space proactively, making their processes more effective
- Change up space allocation processes. People tend to keep coming back to the spaces and desks they know, so changing up desk allocation models – e.g switching to bookable hot desks or repurposing other areas to accommodate overflow – can alleviate overcrowding
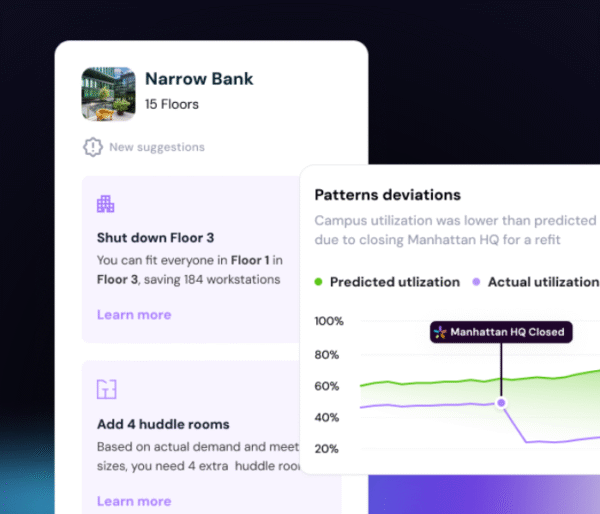
Case Study: How ABN AMRO optimized space allocation with space utilization data
Leading Dutch bank ABN AMRO measured space utilization for specific floors and departmental zones to reduce overcrowding on busier days and optimize occupancy across 24 floors and almost 10,000 employees.

3. Weekly Space Utilization Patterns
What it is:
Daily space utilization rate over a standard working week that illuminates weekly occupancy patterns. For most organizations using hybrid working, weekly space utilization rate tends to peak on Tuesdays, Wednesdays and Thursdays and trough on Mondays and Fridays.
How to calculate it:
Space utilization patterns are more about visualization than calculations. Plot daily utilization averages over the week and notice the increases and decreases.
How to use weekly space utilization to build a better workplace:
- Cut emissions on empty days. Mondays and Fridays are consistently the least popular, and you’re probably seeing that reflected in weekly utilization patterns. That opens up opportunities to throttle down HVAC and facilities management on emptier days, and even temporarily close down floors and zones if the data shows hardly anyone is using them
- Shift attendance more evenly over the week. Putting a new hybrid policy in place or giving individual teams the flexibility to decide when they come in can reduce the strain the mid-week peak puts on office spaces and services
- Improve hybrid policies. One in five employees ignore RTO mandates, and 40% of managers reported knowing about policy violations but not doing anything about it. If you’re using a specific days model of hybrid but utilization data shows people aren’t coming in when they’re supposed to be, a more effective approach is usually to lighten the mandate and reduce employee resent and frustration rather than continuing to force a square peg into a round hole
Failed Hybrid Policy Guide: Turn a Crisis into a Competitive Advantage
If you roll out a hybrid policy or schedule that totally flops, all hope is not lost. Here's what to do if your organization's hybrid policy fails, why it happens, real world examples and how to fix it.

4. Long-term space utilization trends
What it is:
The overall direction of office space utilization in the long-term. It’s similar to weekly space utilization, but with the intent of tracking how employees are using the office space over weeks, months and years.
Patterns repeat themselves, while trends show how behaviour is changing medium and long-term. Space utilization trends measure how appealing the office is to employees, and how changes in the workplace impact occupancy.
How to calculate it:
Plot average utilization rates over weeks and months. It’s easiest if you have a space utilization software to do this part for you.
How to use long-term space utilization trends to build a better workplace:
- Test the effectiveness of portfolio and design changes. Plot trends against events like hybrid policy changes, company meetings and renovations to test what boosts attendance meaningfully and what doesn’t.
- Invest in the right amenities. Figuring out whether yoga rooms and weekly mentoring sessions actually boost attendance takes time. Once something is no longer new and exciting, space utilization trends will show whether it’s making a meaningful difference to your workplace experience
- Get the correct ratio of individual to collaborative spaces. Most people come into the office to meet with colleagues, but not all. Comparing space utilization trends between individual and collaborative spaces shows how the purpose of the office is changing long term (not just because of a busy season or week) and illuminates what the right ratio will be
The Complete Guide to Hybrid Work in 2026
Why is hybrid work STILL so polarizing? Check out this guide for hybrid work best practices, strategies, tactics, and the right tech to add to your stack to pull it off.

5. Predicted Space Utilization Rate
What it is:
Expected workplace space utilization levels based on current patterns and trends.
How to calculate it:
Similarly to space utilization trends, it’s easiest to have a space utilization solution do the heavy lifting for you.
How to use predicted space utilization to build a better workplace:
- Reduce waste and carbon emissions. Ensure spend on utilities, facilities management and even office furniture is proportional to employee occupancy. For example, use predicted space utilization rate to order food for the cafeteria for the week ahead and cut back on food waste and carbon emissions
- Increase space sharing ratios. Increasing the ratio of employees to available desks is a natural consequence of hybrid work, but having a long-term view of utilization helps you pinpoint the areas you can get more out of
- Make big CRE portfolio decisions with certainty. Visualizing how space utilization will trend in the months and years makes already difficult decisions – finding suitable office space and letting go of a lease – far less catastrophic
Case Study: How a Fortune 500 Company Reduced Their CRE Portfolio by 40%
Using a combination of space utilization data, user-friendly workplace booking and integrated hybrid data management, this Fortune 500 firm saved millions in operating costs by reducing their portfolio by almost half.

Office Space Utilization Data Sources
he best metrics are only as effective as the data you’re measuring them with.
Although space utilization is catching on as one of the most critical metrics, most organizations lack workplace data that’s broad and granular enough to actually track these five metrics.
According to JLL’s 2025 Occupancy Benchmarking Report, organizations are tracking utilization through:
- Badge swipes: 90% are using this data source
- Reservation systems: 49%
- Visual observation: 41%
While each of these is valuable in their own way, they’re not accurate unless combined with other data sources.
That’s because badge swipes only measure whether or not someone has entered the building. Data from reservation systems only measures utilization from parts of the office with bookable desks and rooms. Visual observation isn’t detailed or frequent enough to quantify employee behaviour and use of space.
Measuring office space utilization from a mix of sources including WiFi signals, occupancy sensors and reservations means you’re able to cover the entire portfolio more broadly while getting the right level of detail for smaller spaces like meeting rooms and collaboration spaces.
Start tracking these 5 metrics with accurate real-time data
HubStar's space utilization software pulls real-time data from WiFi, occupancy sensors, reservations, and badge swipes into one platform and then shows you how every floor, zone and room is performing.
Jackie Towers
Share this post
You might also like