Webinar recap | HubStar x JLL
56% Full and Flying Blind: 7 Questions JLL’s 2026 Occupancy Benchmark Raises for Workplace Leaders
Offices are 56% full against a 74% target. Last week, JLL’s occupancy planning experts joined HubStar to answer the big questions from their 2026 Global Occupancy Planning Benchmark: what good utilization really looks like, whether badge data is enough, where AI fits, and how to get leaders aligned on what the data really means.

Hannah Cresswell
Most workplace teams have data. Very few trust it enough to act on it.
That gap sits at the heart of JLL’s 2026 Global Occupancy Planning Benchmark Report. A key theme of the report was how leading organizations are closing the gap between workplace data and effective portfolio decisions. So we dove even deeper into this gap in our October 27 webinar, where JLL’s Matt Quadrio, North America lead for occupancy planning and management, and Wei Xie, JLL’s Global Head of Research and Strategy for workplace management, joined HubStar’s Jane Young to unpack the findings.
We also put the data-decisions gap question to our audience of workplace leaders. In five live polls, attendees told us how much they trust their own data, what’s holding back AI, and where structured hybrid is breaking down. Here’s what we learned, and what JLL’s experts advise doing about it.
Watch the full conversation with JLL and HubStar
Matt Quadrio walks through JLL’s 2026 benchmark data, Wei Xie and Jane Young dig into AI, hybrid and stakeholder alignment, and you’ll see every live poll result as it came in.

The numbers at a glance
From JLL’s 2026 Global Occupancy Planning Benchmark Report
JLL’s benchmark draws on its global client base to show where office utilization, hybrid policy and AI adoption stand today.
- 56%: average global office utilization in 2026, up about two points year over year and five points below the 61% recorded in 2019.
- 74%: the average utilization target across JLL’s client base, leaving an 18-point gap to close.
- 1.3 people per seat: the global average sharing ratio, as organizations stop building a desk for every employee.
- About 70%: the share of organizations asking employees to come in three to five days a week, up from about 60% a year earlier.
- 31%: the share of organizations running change management programs to help people use the office well.
- 26%: the share of occupiers who have embedded AI end to end in occupancy planning; 34% are still exploring tools and 40% haven’t started.
From our live audience polls
We asked webinar attendees five questions during the session. The answers reveal a clear confidence gap: most teams have data, but few trust it enough to act on it.
- 95% of webinar attendees polled aren’t fully confident their occupancy data could support major portfolio decisions. Only 4.7% are very confident.
- 86% can’t confidently say what their utilization data tells them to do next. Most said it only sometimes points to a decision.
- 96% aren’t fully confident their workspace mix matches how people actually work.
- Systems integration was the #1 barrier to getting value from AI in occupancy planning, ahead of skills and trust, data quality, privacy and cost.
- Peak-day crowding was the #1 challenge in making structured hybrid work.
- Aligning HR, CRE and business leaders ranked joint second, level with getting people to attend.
Do workplace teams trust their occupancy data?
Not enough to bet a portfolio decision on it: only 4.7% of webinar attendees polled were very confident their occupancy data could support major portfolio decisions.
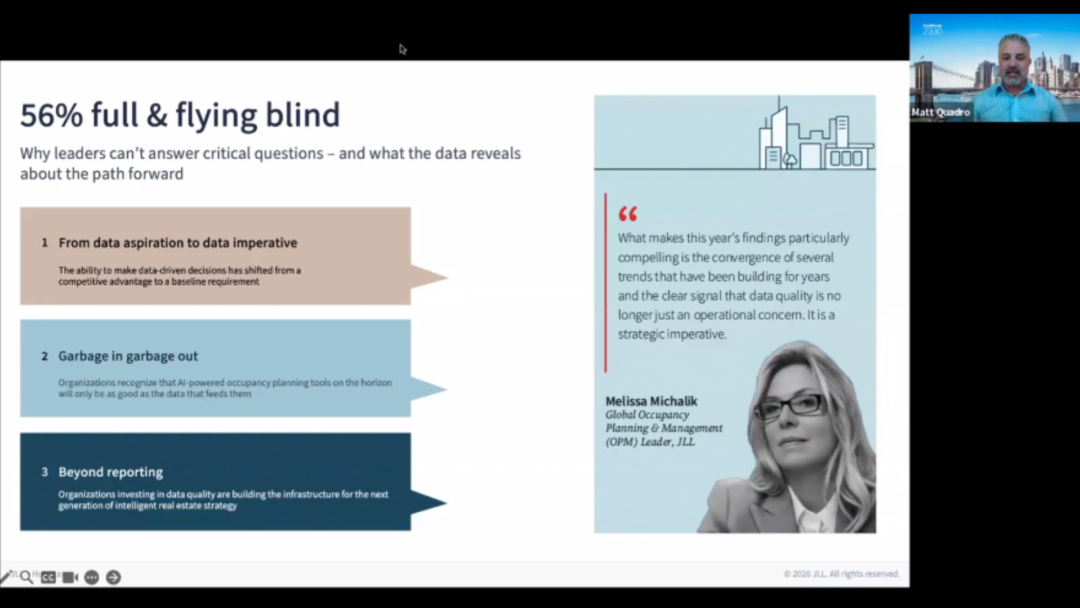
Most sit somewhere in the middle. Just over half were mostly confident, and more than a third were not very confident. That lines up with JLL’s research: improved data accuracy and reporting has climbed to the number two priority for corporate real estate leaders, behind only optimizing the portfolio. As Matt Quadrio reminded us, it’s still “garbage in, garbage out.”
So why is confidence so low? Matt pointed to how quickly occupancy data goes out of date. Org changes, mergers and acquisitions constantly shift who sits where, and the data that tracks it is spread across CRE, HR, IT and security teams. Unless those sources are connected and kept current, the numbers behind a big decision may already be stale.
The gap widens when it comes to action. Only 14% of attendees said their utilization data confidently tells them what decision to make next; most said “sometimes.” For most teams, the problem isn’t a lack of data. It’s the distance between having numbers and knowing what to do with them.
Watch clip
What does good office utilization look like?
There’s no universal number: good utilization depends on how your organization defines it, which days you count, and what you want the office to achieve.
JLL’s 56% global average is a useful benchmark, but as Jane put it, “56% isn’t good or bad on its own.” Wei Xie pointed out that utilization isn’t even one consistent measure. Some organizations count five days a week; others count only the days they expect people in. Matt offered an extreme example: a company that asks everyone in on Tuesdays might reasonably measure Tuesday alone as its mark of success, as long as leadership accepts what happens the rest of the week.
Matt also noted that the utilization drop didn’t start with the pandemic. As people moved from desktop machines to laptops and phones, they became less tethered to a desk, and offices were emptying out well before 2020. Getting people back in is only part of the job. The bigger question is what experience the office needs to offer now that anyone can work anywhere.
Wei’s advice was to start with the organization’s mission and how it defines good collaboration, then set occupancy targets to serve it. Matt added the case for segmenting: a focused engineering team and a highly collaborative sales team use space very differently, so one company-wide target can hide more than it reveals. For a second benchmark alongside JLL’s, HubStar’s Hybrid Occupancy Index tracks real utilization patterns across hybrid offices.
Why isn’t badge data enough to measure utilization?
Badge data shows who entered the building, not how the space inside was used, so on its own it can’t tell you whether the office is working.
Matt called it “low-hanging fruit.” Almost every organization has it, and it has grown from a project-by-project tool into an ongoing utilization check. Wei described it as a convenient proxy, but far from the full picture: lease, HR and finance data all shape how a portfolio really performs. Sensors and Wi-Fi can take you down to the zone or space level, but they take more investment. Matt expects more organizations to make that move as badge data keeps failing to answer their questions.
The answer, Jane argued, is to match the data source to the decision. For portfolio-level supply and demand, abstracted data (often badge alone) can give a strong picture, and many teams get a lot out of it with dynamic occupancy planning. To right-size meeting rooms, you need room-level detail.
One attendee pushed further: if utilization still measures a version of attendance, how do you measure effectiveness? Matt was blunt: “Badge data is not going to measure effectiveness.” Wei described JLL’s own approach. Alongside its annual people survey, JLL regularly asks office-based employees whether their workspace serves its purpose, then acts on the pain points.
Where does AI fit in occupancy planning today?
AI is widely used in occupancy planning but rarely embedded: just 26% of occupiers in JLL’s research have built it into the process end to end.
Wei put it neatly: “The prevalence of AI deployment is not the same as the maturity of AI deployment.” Most organizations use AI for document processing, data collection and forecasting, and 40% haven’t started deploying it in occupancy planning at all.
Our audience pointed to why. Systems integration was the biggest barrier to getting value from AI, ahead of skills and trust, and data quality. Wei noted that integration can take years, and depends on data that’s standardized, unified and protected. Matt sees AI readiness in three parts: a system that holds and curates your data, processes that keep it current, and people who understand how it feeds AI and can sense-check what comes out.
Looking ahead, Wei compared AI to satellite navigation. It could take on the work of collecting and reconciling lease, HR, finance and space data, leaving planners to choose the destination. Matt added a practical limit. AI will make restack and metro scenarios faster to produce, but choosing between four sensible options still depends on leadership context that AI doesn’t have.
Jane raised the question that comes next: if AI compresses the time between sensing, deciding and acting, are teams set up to execute at that speed? Solving the data is step one. Rethinking how CRE teams are structured to act on it may be step two.
Watch clip
Is getting people into the office the real goal?
No. Attendance is a means, not the end, and the real outcome, productivity, is still the one most teams can’t measure.
Structured hybrid is rising: in JLL’s research, the share of organizations asking for three to five office days grew from about 60% to about 70% year over year, and mandates are increasing too. But as Matt admitted, productivity still has no reliable link to utilization.
Getting people in also creates new problems. Avoiding peak-day overcrowding was the hardest part of structured hybrid for our audience. Matt’s advice was to look at the spaces that sit idle for much of the day: a café that’s quiet outside lunchtime, or collaboration areas that can double as heads-down space when the floor is full.
And only 31% of organizations run change management programs, according to JLL. When an attendee asked why those programs are declining, Matt pointed to cost: they take time and investment, and often fall away when budgets tighten. Without them, people may come in without knowing how to use the spaces designed for them.
Those spaces are changing. JLL sees fewer private offices and more phone booths, phone rooms and small meeting rooms, giving people somewhere to do focused work in open environments. The global average sharing ratio now sits at 1.3 people per seat.
And plans can flip quickly. Matt warned that “real estate doesn’t turn on a dime.” A new leader who moves from shared seating to five days a week can leave a compressed portfolio short of seats. Jane’s answer is to model the change before you make it: what happens to seats and floors if you move from three days to four, before the announcement goes out.
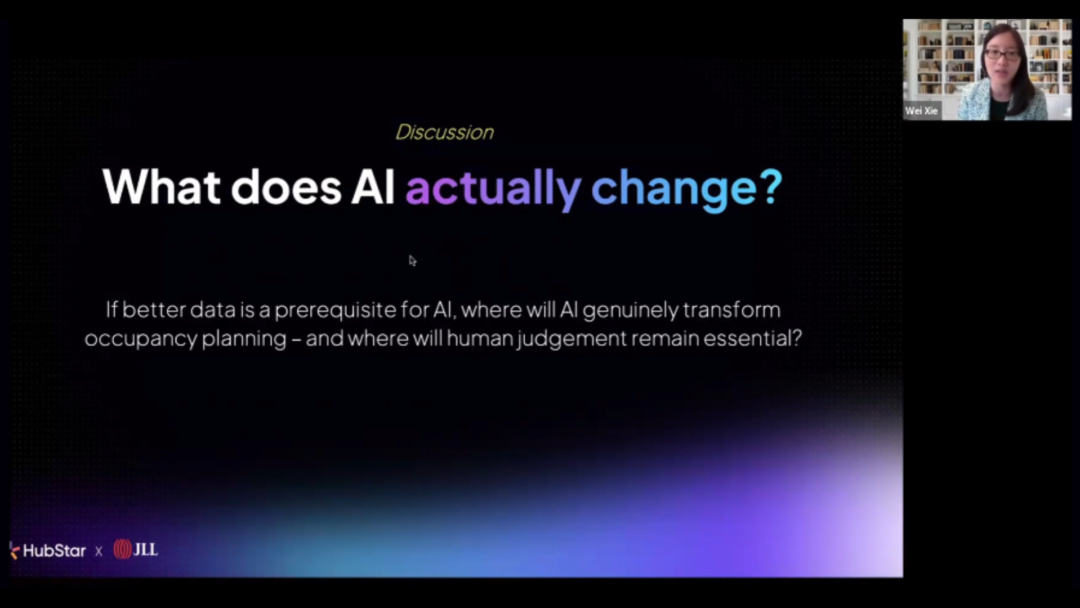
Is the biggest barrier the data, or the people?
Increasingly, it’s the people: aligning HR, CRE and business leaders ranked joint second among the hardest parts of structured hybrid, level with getting people to attend.
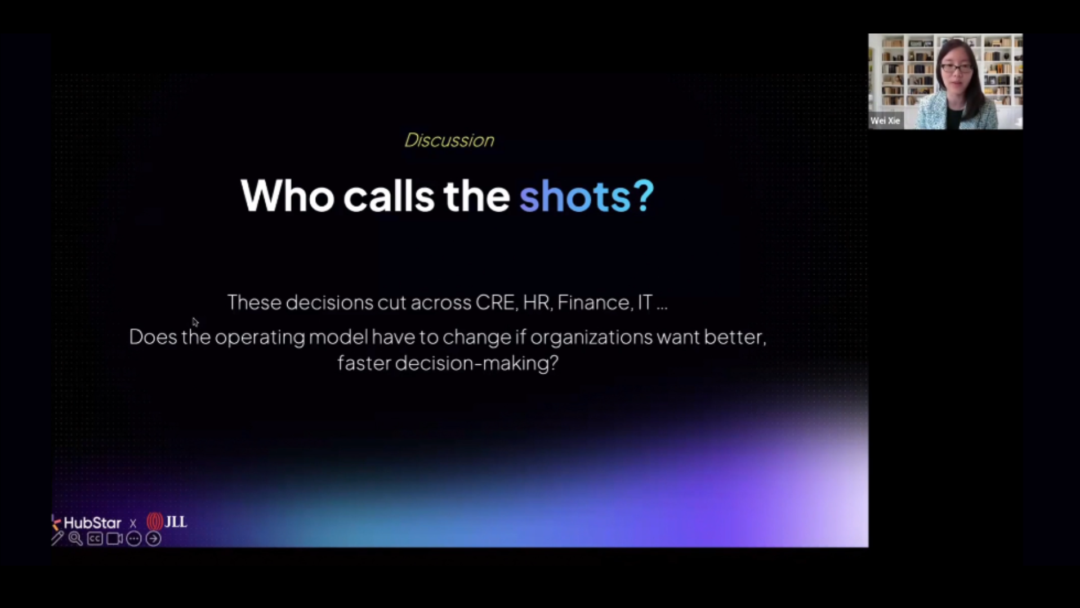
Jane noted that stakeholder alignment comes up at the top of nearly every barriers poll HubStar runs, and this audience was no different. Matt put it simply: CRE, finance, HR and IT are all “calling shots,” but not necessarily collaborating on them.
Wei shared that a separate JLL survey asked leaders in different roles how they define success. Their answers didn’t match. Her recommendation is a shared scorecard covering financial, people, real estate and technology goals, agreed across functions, so everyone steers toward the same destination. It matters more as AI speeds up the journey from data to decision: misaligned teams can’t act fast enough to keep up.
That includes data owned outside CRE. When an attendee asked whether commute and access belong in occupancy planning, the panel noted that much of it is settled earlier, in location and lease decisions, but that whoever owns commute data should share it in a form planners can use.
As Jane put it, “it’s game on for anybody who wants to be the change maker in the room”: the person who brings the data and the clarity to the table, and works the alignment.
Watch clip
Where should you start?
Start with a complete, trusted inventory of your space and people data, then layer more detailed sources like badge, Wi-Fi and sensor data on top.
The panel’s advice adds up to a simple sequence for workplace and real estate teams:
- Agree what “good” looks like. Define utilization against your workplace mission, not a single portfolio-wide target.
- Fix the foundation. Make sure your floor plans, headcount, business units and policies are accurate and kept in one place.
- Match data to decisions. Use the source that fits the question: badge data for building-level trends, sensor-level data for questions like right-sizing meeting rooms.
- Get data owners in the same room. Bring HR, CRE and business leaders around one shared view so the numbers drive decisions, not debates.
Jane explained how HubStar approaches this with customers: assess where you are today, then choose the starting point that gets you to your goals fastest. Often that’s Hub, HubStar’s space data management solution, which holds your space, people, business units and policies in one place. As she put it to close the session, “56% full and flying blind does not have to be where you stay.”
Build a data foundation you can trust
Our team will help you work out where you are today, which data you can trust, and the fastest route to your next decision.
Hannah Cresswell
Share this post
Go deeper