How to Move from Data Capture to Insight: Takeaways from AUDE
In this post, HubStar's Richard Preston shares his takeaways from AUDE's autumn conference on how institutions can move from merely collecting campus occupancy data to acting on it.

Richard Preston
Last week I joined Digitising Your Estate: From Capture to Insight at AUDE’s autumn conference.The panel brought together three people doing this work for real: Rich Draper, Head of Estates Digital at the University of Oxford; Matt Beveridge, Assistant Director of Estates at the University of Birmingham; and Brett Plant, Head of Estates Information and Systems at the University of Warwick. Paul Wilson, Chair of Provelio, joined them.
The main topic of discussion was AUDE’s guide, How to Digitise and Visualise Your Estate: Bringing Estates Intelligence to Life, launched in autumn 2025. It sets out a six-stage roadmap to fully digitising your institution’s estate. Capture, Visual and Analytical make up the static digital estate. Real time, semi autonomous and fully autonomous data capture make up the smart digital estate.
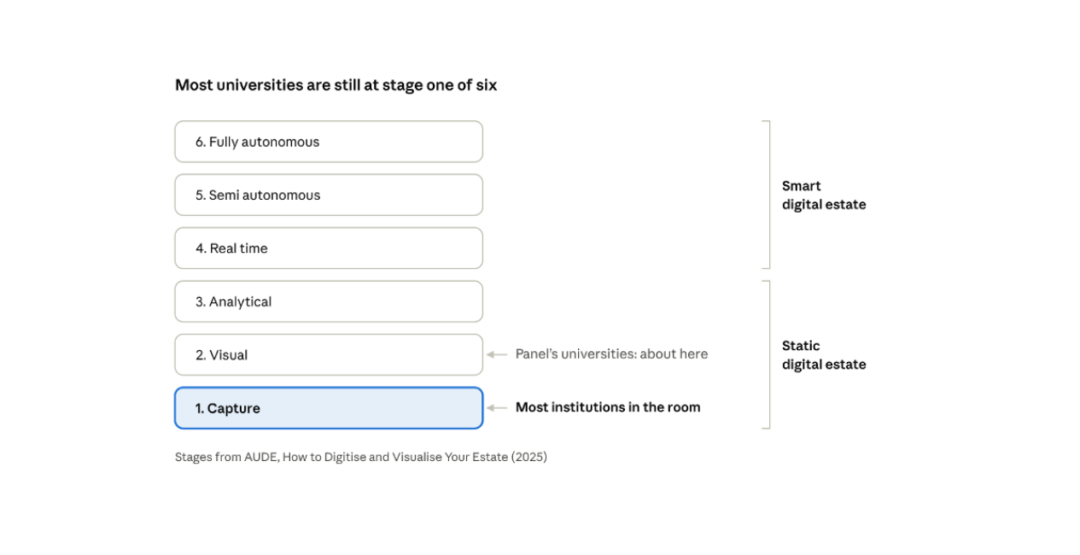
The institutions behind the guide place themselves around stage two of six. Most people in the room were still on stage one, getting the data captured in the first place.
Estates teams have multiple systems but struggle to capture data.
Panellists described estates teams running more than 90 systems.
The data sits across all of those platforms, and parts of it are out of date. Gathering it into one trustworthy view becomes a project in its own right, which is why so many institutions are stuck at Capture.
The panel was candid that data governance and classification had been a long struggle, and they now feel they’re past it. That moves the conversation to a sharper question: what do estates teams actually want to achieve? For most people in the room, the answer was a consolidated estate with fewer systems and all the data in one place, kept current.
Boardrooms respond to a visual picture of the campus.
Visual is stage two on the roadmap, and the panel made a strong case for it. In their experience, CFOs, boards and executive teams engage far more with a picture of the campus than with a spreadsheet of red and green numbers. Show them what the estate looks like right now and they gain the confidence to decide faster.
Visualising depends on capturing, though, and much of the discussion came back to that practical problem. How do you present a clear picture to senior leaders when the data underneath is scattered across systems?
Interoperability and data monitoring were the biggest audience painpoints.
Two themes dominated the audience questions.
The first was interoperability. Delegates wanted systems that talk to each other, and for many, today’s systems work in isolation. That’s a real barrier to getting data into one place.
The second was monitoring. More than once, someone asked what data is being collected and why. Rich Draper gave the clearest framing I heard all day: the aim is to manage the building. Estates teams look at how space is used, so they can run the building better. For any institution worried about how occupancy data will land with staff and students, that framing is worth borrowing.
Implementation and continuity are the biggest technology gaps.
sked about the biggest technology gap, the panel named rollout and post-implementation.
Too often, technology goes in and the institution is left to work it out alone. Learning to use it well, bringing new people on board and evolving it as the questions change is where the value leaks away.
So when you choose technology, ask what happens in month six. Who trains the next wave of users? Who helps refine the set-up when priorities shift?
Understanding space utilisation is the 5 year priority.
The last question went to the whole panel: what will have the biggest technology impact on universities over the next five years? The answer was space occupancy and utilisation.
That matched every conversation I had across the day. Every university I spoke to knows it needs to understand utilisation, and most want something simple and straightforward to start with. Only a handful of the larger research-intensive institutions are genuinely leading with the technology today.
The cost pressure is clear in the numbers. AUDE’s own 2025 Estates Management Report points to sharply rising operating costs and a great deal of university space that is not used in an economically viable way. Meanwhile, the Home Office received 33% fewer sponsored study visa applications in January to April 2026 than a year earlier (ICEF Monitor). Higher running costs and fewer international applicants put every square metre under scrutiny.
The first 3 steps for estates teams and how HubStar can help.
he AUDE guide is clear that universities move at the speed their resources allow. A fully autonomous campus can wait. The goal is to take the first three steps well: capture, visualise, analyse.
Three practical lessons came out of the session:
- Start with what you already have. Most campuses already hold occupancy signals in Wi-Fi, timetabling, access control and booking systems. Capture means bringing those signals together into a single view of the estate.
- Design for the board from day one. Make a picture of the campus for finance and executive teams the starting point for report design.
- Choose partners for month six. Ask how training, onboarding and refinement work after go-live.
This is the space HubStar works in, and it maps closely to those first three stages:
- Capture. HubStar PresenceIQ brings occupancy data from Wi-Fi, sensors, badge and access control, and booking and timetabling systems into a single source of truth, so your team works from one set of figures. HubStar peel-and-stick sensors deploy quickly and fill the gap. HubStar Hub holds CAD floorplans and the space inventory as the foundation.
- Visual. Floorplan and portfolio views run from the whole estate down to individual zones. They give senior leaders a picture of the campus, the format the panel said boards engage with.
- Analytical. Descriptive, predictive and prescriptive insights, threshold alerts, and utilisation aligned with the timetable show your team how space is used and when. Hub then models space supply against demand.
- Privacy by design. PresenceIQ does not process personally identifiable information, and device identifiers are anonymised at source. It measures the building, which lets you answer staff and students who ask what is being collected.
Most universities are at stage one. But if your institution is working through the AUDE roadmap and you want to compare notes, let’s chat!
Richard Preston
Share this post