3 Reasons Why Your Space Utilization Data Isn’t Accurate
We polled workplace leaders in a recent webinar, and only 12% said they could trust the accuracy of their space utilization data. Here are 3 reasons why that's happening, and how to fix it.

Jackie Towers

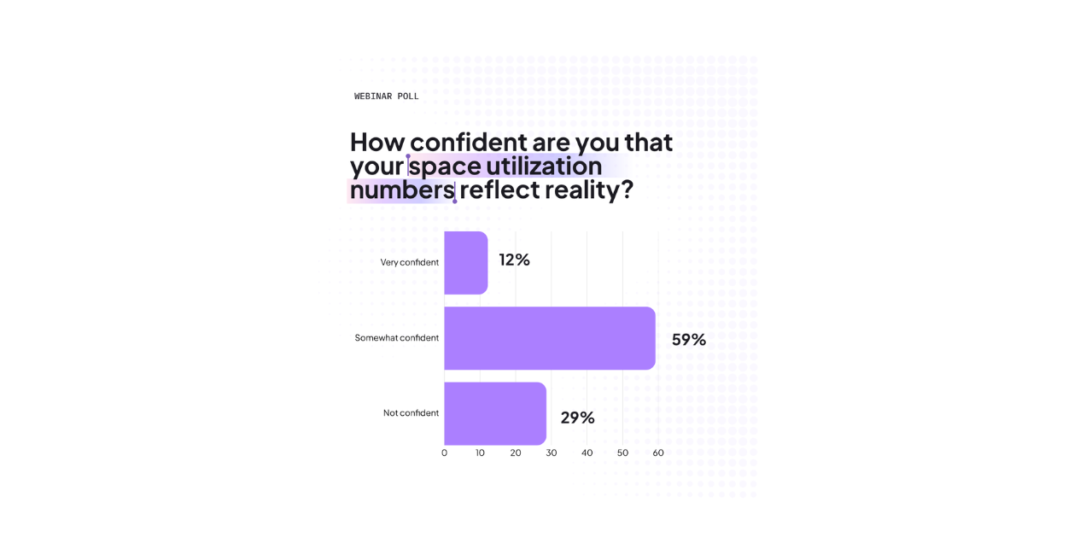
In a recent HubStar webinar, we polled our audience of workplace leaders about how confident they felt in the accuracy of their space utilization data.
Only 12% were confident their space utilization numbers reflect reality. 59% were mostly confident, and 29% weren’t confident at all.
With space data accuracy being Corporate Real Estate’s second priority according to JLL’s 2026 Occupancy Planning Benchmarking report, untrustworthy data is not a great state to be in.
We’re also seeing this lack of certainty reflected on a wider scale. CBRE’s Global Occupancy and Insights series found that over half of organizations cite data quality and availability as the main obstacle to implementing workplace-optimizing AI. Only 7% of organizations surveyed in JLL’s Benchmarking Report rated their overall data capabilities as excellent.
Inaccurate data creates inaccurate workplace decisions.
Space utilization has been the most important metric for occupancy planners for over three years now according to JLL, so getting it right is imperative.
In this post, we’ll cover three reasons why you can’t trust the accuracy of your organization’s space utilization data, and what you can do about it.
Are you measuring these 5 core metrics yet?
From space utilization to employee engagement, great workplaces are built on great data. Download this toolkit for a framework on how to use each one to make accurate workplace decisions.
Reason 1) Data sources aren’t providing complete portfolio coverage.
You can’t know what’s going on if you only have very limited visibility into some areas of your portfolio but not others. A lack of broad data coverage will leave you vulnerable to workplace challenges looming ominously below, like the swimmer in the poster for 1975’s Jaws.
Organizations can be drowning in utilization data, but the data doesn’t have enough breadth to be trustworthy because of where it’s collected from and what it actually measures.
92% of organizations surveyed in JLL’s 2026 Occupancy Planning Benchmarking Report use badge swipes for collecting occupancy data. But let’s jump back to a few paragraphs ago where we learned that only 7% say their overall data capability is excellent.
Badge swipes are great for telling you how many people are coming into the office, but not so great at telling you which spaces they’re using after they swipe in for the day. Some floors might be empty and some might be over-utilized, and you’d have no idea.
The result is inaccurate space utilization data. Not because badge swipe data is wrong, but because it doesn’t provide any context.
So, what to do?
The answer is pulling space utilization data from a range of sources that are broad, like badge swipes, granular, like occupancy sensors, and both broad and granular, like WiFi signals.
Badge swipes provide a yes/no binary answer to whether people are coming into the office, but don’t measure behavior.
Occupancy sensors are too costly to install across your entire portfolio, but invaluable in smaller spaces like meeting rooms.
Anonymous WiFi signals are both broad and granular and work well for neighborhoods and zones.
Combining badge, sensors, and Wifi data gives you broad and granular coverage.
Reason 2) Too much data and not enough analysis of it.
Collecting data that covers your entire portfolio is step one. Analyzing it by space type and time frame is step two, and if this step isn’t done sufficiently or at all, your existing utilization data doesn’t provide an accurate picture of what’s happening across the portfolio.
Space utilization is a series of metrics, not one, and so asking “what’s our current utilization rate?” and taking the answer at face value is an inaccurate measure of what’s happening in the office.
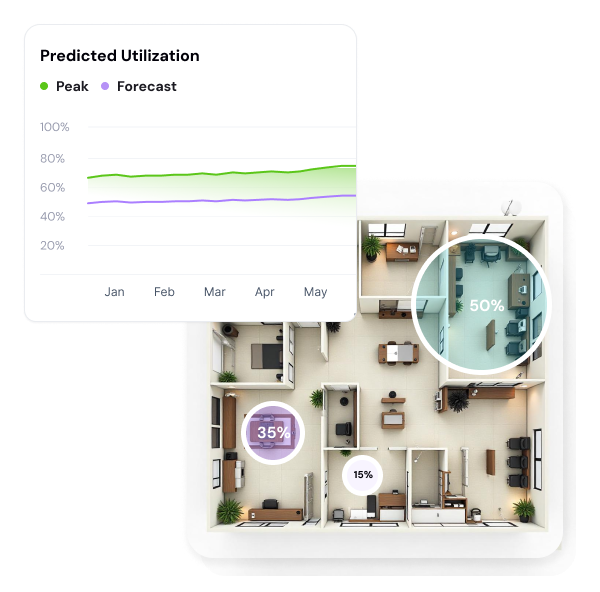
CBRE’s Global Occupancy and Insights Series found that global space utilization peaks at 80%. By itself, 80% provides the information that utilization is close to capacity and comfort levels. But compare the 80% with global average of 53%, and you realize that one number can’t accurately measure reality. A CRE lead with the 80% figure might think it’s time to expand the portfolio, when really, multiple floors or buildings are barely used on specific days.
Meeting rooms also make this point. HubStar’s Hybrid Occupancy Index found that most meetings take place in rooms with a capacity of fewer than 6, and meeting rooms for 2 are only 50% full. A space-type comparison illuminates what’s actually happening.
And as CBRE’s Susan Wasmund and Lynn Patzner put it, “Absent the right technology tools, organizations lose visibility into real-time utilization, leaving them with static occupancy rates—a legacy metric that lacks the nuance required for modern decision-making.“
So, what to do?
Analyze utilization by comparing:
- Space types (e.g. individual focus vs collaborative)
- Times (e.g. utilization by days of the week)
- Space sizes (e.g. large vs small meeting rooms)
5 Office Space Utilization Metrics for a Better Workplace in 2026
Contrary to popular belief, space utilization isn't just one metric but a group of metrics. Here are the five space utilization metrics every workplace should be measuring .

Reason 3) Utilization data lives in different silos and systems.
Accurate utilization data becomes functionally inaccurate when it sits in separate places and with different people. Real estate, HR, IT and finance each hold a piece of the picture, each in its own system, and each team works from its own version of the truth.
Again, CBRE shows how common this is. 86% of organizations incorporate HR data into their space management systems, but only 3% have advanced functionality that gives a holistic view of everything.
Inaccurate utilization data can also stem from stakeholder misalignment, even when stakeholders have the same goals.
Improving office experience is an objective for both HR and CRE teams, for example. HR teams might look at low NPS scores and conclude that the office experience is lacking. But CRE teams will look at data showing a 70% utilization rate and falsely conclude the office experience must be fine, and shut down conversations with HR about why it’s lacking.
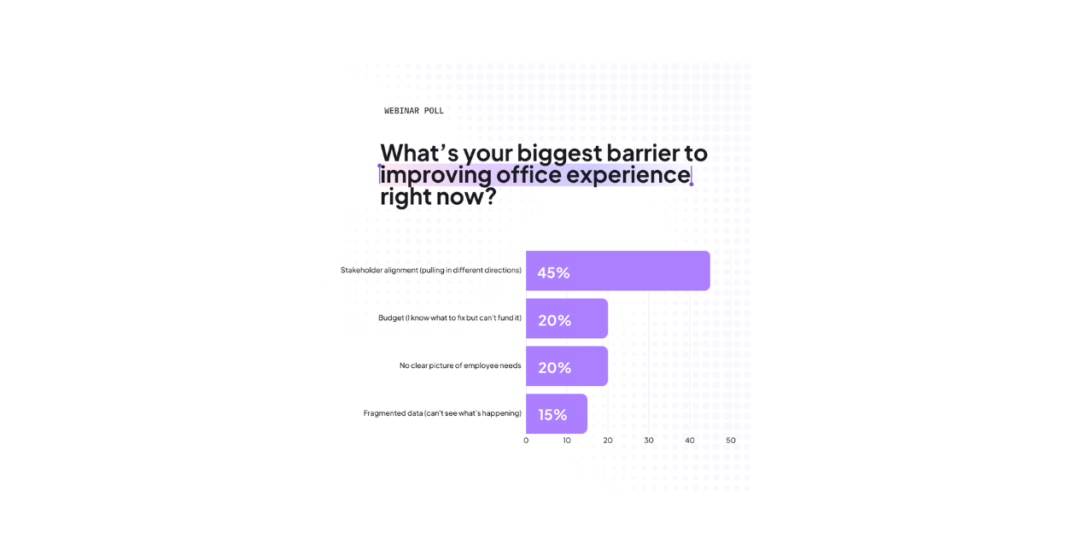
Another webinar poll we conducted revealed that stakeholder misalignment is the biggest barrier to improving office experience, even more so than fragmented data.
Stakeholder misalignment can also stall any collective drive to improve data accuracy, especially if utilization data is viewed as “just a CRE problem”, rather than a valuable measure for what’s happening in the workplace for multiple teams.
Just 20% of organizations audit their data accuracy annually, according to JLL’s Benchmarking Report. With the pace the workplace is changing, that’s just not enough.
So, what to do?
- Keep utilization data in one place to make starting conversations with stakeholders easier. HubStar, for example, centralizes and synchronizes people, place and policy information in one view
- Define guardrails and areas of shared ownership for each team
- Schedule regular workplace review cadences that include audits of data accuracy
HubStar gives you space utilization data you can trust
HubStar pulls data from the sources you already have, like occupancy sensors and anonymous WiFi signals, and aggregates everything in a single view.
Jackie Towers
Share this post